Making Geological Maps With QGIS

Creating geological maps in GIS has always been a bit tricky. I choose QGIS for its open-source nature, versatile capabilities, huge community, and useful plugins. Here, I will outline my workflow for creating a geological map using QGIS. I dont go over very basic QGIS instructions like how to install extensions or create a polygon. Plenty of guides are always a small google away.
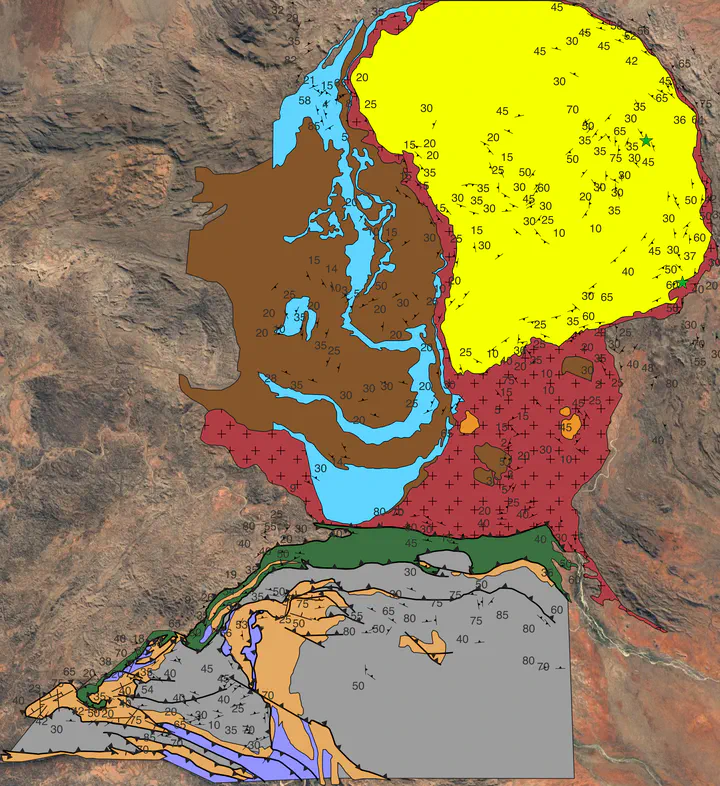
I use an example from the Ruby Gap Duplex and the Entia Dome in Central Australia. The geological data comes from the Northern Territory Geological Surveys “Quartz” Mapsheet that I digitized.
Step 1: Digitizing Geological Polygons
To begin, create a new project in QGIS and add a base map to provide context for your geological data (google satellites, a DEM etc.. The QuickMapServices can make this a breeze). Next, digitize geological polygons by creating a new polygon layer and drawing the boundaries of each geological unit. Make sure to include relevant attributes, such as unit name, age, and rock type, to facilitate the subsequent steps. I use one polygon layer for all my lithological units, and distinguish them based off of an attribute (’name’ in my case) in the symbology properties.
Step 2: Digitizing Faults as Lines
In a similar fashion, create a new line layer to represent faults within your study area. Draw fault lines and include pertinent attributes, such as fault type and sense of movement.
Step 3: Importing and Customizing Symbology
To visually differentiate your geological units and display structural symbologies (strike/dips, fault type etc..), we have to either import or create custom symbology. One option is the FGDC-4-QGIS repository found at [https://github.com/BC-Consulting/FGDC-4-QGIS](https://github.com/BC-Consulting/FGDC-4-QGIS The USGS as well as other geological surveys have sets of files publically available. The NSW Seamless Geology QGIS file is loaded with goodies. If you want to make your own use a vector graphics program such as Adobe Illustrator or the free alternative Inkscape, and save these out as svg files. Follow these steps to import and apply symbology:
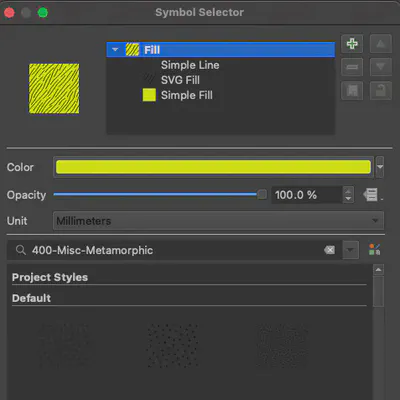
Open the QGIS Style Manager and import the XML files from the extracted folder. Alternatively, you can also place the svg folder directly in the QGIS svg folder. You can set each geologic layer to a symbology (categorize by rock type, or unit name etc..) and add a background colour.

For faults, use the SVG symbology that corresponds to your fault type. If the markers are facing the wrong direction, use the “Reverse Line” tool to correct their orientation.
Step 4: Importing Structural Data To incorporate structural data (e.g., foliation, lineation, bedding) into your map, follow these steps:
a. Prepare a CSV file containing structural data, including coordinates (longitude/latitude or a grid projection).
b. Ensure the data is formatted correctly, as shown in the example below:
c. In QGIS, add a delimited text layer using the prepared CSV file.
Step 5: Customizing Structural Data Symbology and Labels
Finally, to visualize and label the structural data effectively, follow these steps:
a. In the layer symbology, classify the data by type.
b. Use SVG markers to represent different structural elements.
c. Ensure that the rotation settings are compatible with your chosen SVG markers. So if your bedding data uses the right hand rule, the strike line in the svg file has to be vertical, with the dip tick to the right.
d. Use the ‘Strike_PlngDir’ field to calculate the rotation of the SVG marker. This will rotate your vector by the strike or plunge direction.
e. To offset dip/plunge labels for neater visualisation, use an expression that calculates the unit vector in the direction of strike for the X and Y components, as shown below:
to_string((cos(radians("Strke_PlngDir")) * 2 )||','||(sin(radians( "Strke_PlngDir" )) * -2))
The ‘2’ and ‘-2’ are just constants that scale the magnitude of the offset. Larger numbers for larger offsets, smaller numbers for lower offsets.
Where to go From Here
At this point the basic skeleton of your map exists, everything is georeferenced and its all functional. To export your map as an image, you can export the map with the legend, scalebar and georeferencing information. Tons of Youtube tutorials on this.
For aesthetics, I always find it way easier to edit the map in Adobe Illustrator (but I imagine you can do the same with InkScape). If you do choose to do this, dont get too crazy with texture and symbologies, or your Adobe Illustrator might struggle a little. You can even put in all the coloring and symbologies in Illustrator. To do this you have to export your map as an SVG file and import it into your graphics program. If you have text, make sure that you do not export the text as a vector but as a text object in the ’export settings’, so you can edit the writing if need be. You should be able to see and edit all the individual polygons, text etc..
Other Useful tools:
GMDE (https://www.rickallmendinger.net/gmde) is a free program by Rick Allmendinger that is very useful for georeferencing existing geological maps and digitising data, and all sorts of mapping-related endeavours.
One thing that has stumped me so far is how to plot the lineation on a foliation measurement, and have the lineation point to the correct direction, like this:
I’ll update this if I figure it out. If you have any ideas please reach out!